
laross19's Profile
laross19's Posts
I haven't spent a whole lot of time on here the past few years but have had the urge recently to start reading/contributing again. I was a regular back when the ARU fiasco was going on. That was a stressful time but the education to me personally was invaluable.
I'm glad to see so many of the same posters are here providing great insight and excellent articles.
Too bad many have left but maybe they too will return as this is a great site to share ideas.
I hope everyone is doing well and look forward to spending more time on here.
Safeharbour? You still out there??
When reading economic statistics, you should see if they are consistent (they rarely are) and make sense based on real world observations (lately they don't). On Thursday, December 3rd the U.S. productivity numbers were released, as were same store sales and weekly unemployment claims. The stories these three pieces of data are telling are quite different, which means at least one and possibly two of them are not correct.
Productivity in the U.S. is supposedly up astronomically. It rose by 8.1% last quarter and this is after being revised down from being up 9.5%! The recent downward revision of third quarter GDP from 3.5% to 2.8% meant the productivity numbers would be lower as well.
Productivity is essentially the amount of GDP produced per worker. Since employment is falling in the U.S. and GDP is supposedly rising (the two moving in opposite directions is illogical) productivity has to go up. According to the government, it is going up a huge amount. Is there any major new technological advance or innovation accounting for this? None, that anyone knows about.
Economists claim that productivity has gotten better because the least productive workers have been fired. While this might give the numbers a percentage or so boost, it wouldn't give them an 8% boost. The alternative explanation is that GDP is being grossly overstated by the U.S. government. There is substantial documentation that this has indeed been the case for the last three decades.
Same store sales is not a government report and the November numbers clearly show an economy in trouble. Sales were down 0.3% year over year. While this may not seem so bad initially, it is when you consider sales were down 7.7% last November, which was the height of the Credit Crisis meltdown. They are even lower now.
Analysts (who are almost always wrong) originally forecast a 5% to 8% increase for this November. Consumer spending accounts for 72% of U.S. economic activity and is still obviously in bad shape. Yet, the government tells us that GDP is growing nicely. There seems to be a contradiction there.
If you read the mainstream media coverage of the weekly jobless claims you would have seen that the U.S. employment situation is getting better because there were only 457,000 new claims during the week of Thanksgiving. Of course, you might consider that few employers would lay off workers right before a major holiday and that state unemployment offices were closed because of the holiday, so this would obviously lower claims.
The BLS (Bureau of Labor Statistics) states that they make some 'adjustments' for this though. Claims at even the 400,000 level indicate significant recession and they need to drop to the 300,000 level to indicate a healthy economy (you will see much higher numbers cited in most mainstream media reporting). Continuing claims are still rising and have hit 5.5 million. This number doesn't include an additional 4.5 million on extended umemployment benefits.
A large percentage of the American work force is not eligible to collect unemployment as is, so the numbers are even worse than they appear. While there are those who claim that unemployment is a lagging indicator, statistics from the past don't support this notion. The real lagging indicator seems to be the truth about what is really going on in the economy.
These are buoyant times for (some) commodity investors, and (some) commodity producers, but what does it mean in terms of a global recovery?
A common feature among people drawing conclusions about the economy from commodity markets tends to be a sole focus on price, and even then only prices in exchange traded commodities. If buyers outnumber sellers prices rise, so rising prices mean a return of global demand, which in turn means global recovery -- right? Well not quite, despite the enthusiasm displayed in many articles pushing that line. The flaw in this line of thought is that the buyers who are outnumbering sellers in commodity markets need not be end users of the commodity. There can be speculative demand from speculative buyers just as there can be economic demand from industrial buyers. From the point of view of the markets, or the commodity producer, it doesn't matter who the buyer is: more buyers than sellers means rising prices. The problem arises when you use market price -- at face value -- to draw conclusions about the economy. Since most of the people who connect price to economic recovery without digging deeper tend to be economists, I'm assuming economic theories don't allow for speculators.
Let me focus on metals and minerals (e.g. iron ore, coal). People don't eat these (unlike food commodities), they are used as inputs for industrial production. As global demand picks up we would expect to see increasing consumption of metals and minerals. When buyers outnumber sellers prices rise. This is clearly what is occurring at the moment, you only need to look at price charts -- which I haven't reproduced here because we're all familiar with them. But what if the majority of buyers are not end users of the commodity and do not take delivery, i.e. speculative buyers? If the buyer doesn't take delivery then you would expect stockpiles to rise. In other words, if speculators are outnumbering industrialists you would expect to see quantities of the commodity that are available, i.e. stockpiled, to increase. In the first chart we have the base metal stockpiles on the London Metals Exchange.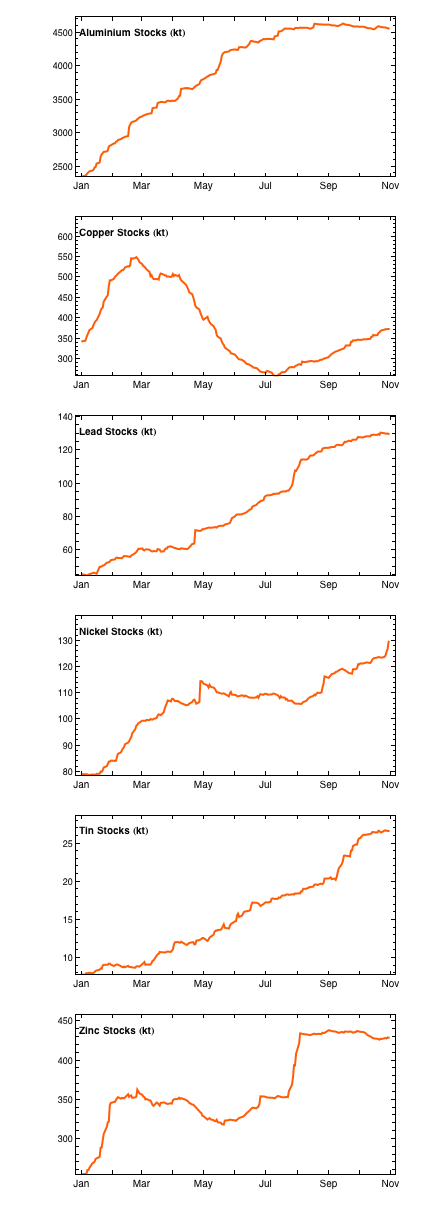
The chart that stands out like dogs' ears among the others is the copper stocks chart. The declining copper stockpile from March through to the end of June coincided with large purchases from China -- verified by Chinese import data. Chinese imports of copper from July dropped off and the copper stockpile has subsequently risen.
The next chart shows that stockpiles in Shanghai follow the same trend of rising stockpiles seen on the LME. Interestingly, copper stocks have steadily risen all year. From this you could conclude that the Chinese copper purchases on the LME were not for immediate industrial use. This makes sense: copper was trading at a 5 year low, China has lots of US dollars, why not accumulate inventories of copper at prices you're not likely to see again for a long while. (Click charts to enlarge.)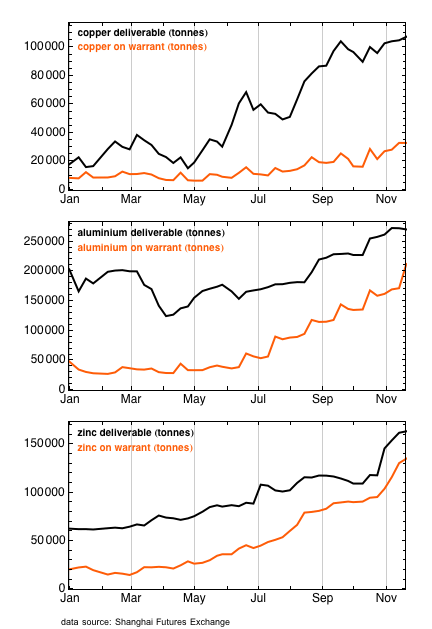
To digress, we also suspect that a lot of the record iron ore imports by China have been stockpiled as well because steel production, while rebounding, doesn't account for all of it, and also Chinese imports of minor components of steel such as manganese are at 2008 levels YOY and chromium is down 16% YOY.
To test the idea that economic demand, as opposed to speculative demand, is weak, the next chart shows a 3 year price history of metals that are not traded on exchanges (these charts come from metalprices.com and minormetals.com). These prices are largely determined between producers and end users. In the absence of speculative buyers we can gauge the relative depth of industrial buyers in the market. 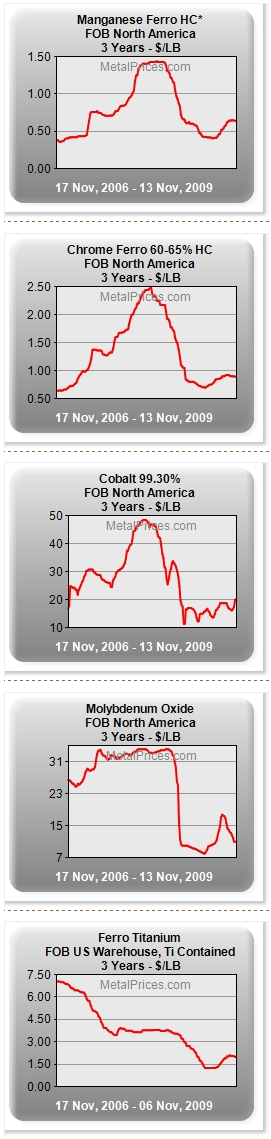
The qualifier is that these metals are mostly used in steel so it could be argued that these charts focus on a single industry. Nevertheless, it demonstrates weak demand in that sector and also demonstrates that strong metals prices pre-crash also existed in non-exchange traded metals. In other words the strong metals prices pre-crash were supported by strong economic demand.
We can conclude from all these charts that economic demand is weak or flat. The world economy may have recovered from the abyss of earlier in the year but we are yet to see a recovery in the sense that we would have used the word pre-crash. It is also worth adding that major miners such as BHP do not expect a recovery in demand until H2 2010.
The next question becomes how to invest in a speculative market. For miners, who cares who is buying your product, you take the cash and book the profits right? Yes, sort of. We are starting to see mothballed projects coming back online but miners would surely have to be cautious about investing capex in a market that is not currently supported by fundamentals.
Among other things commodity prices are rising due to a weak US dollar -- which they must given they are traded in US dollars. Despite the hand wringing among many that is accompanying the fall of the dollar, it seems it is as much to do with interest rate differentials as expansion of money supply (other countries have fiat currencies and printing presses too). So the concern among investors, including miners planning capital expenditure, would/should be what happens when US interest rates eventually rise, relative to other countries, and these speculative positions unwind? That doesn't look like happening anytime soon, and if the USA gets caught in a Japan style rut it may not happen for years.
For now it looks like the party can continue for direct and indirect investors in commodities, but in this sort of market, driven primarily by speculation, you need to know in advance where all the exits are. The panic when someone shouts "fire" could be ugly.
We have begun the drilling program at FDN. It began this week with one drill turning and will increase over the next few weeks to all four rigs on the property working.
We have retained property rights to other concessions. A few concessions that were non-material to Kinross were let go. The focus of the current drilling program will be in-fill drilling to prove up the existing resource at FDN rather than step out drilling for new exploration.
We have reduced throughput at the Paracatu mine to improve recoveries and are currently evaluating the adding more grinding capacity to the circuit. We currently expect the operation to produce approximately 35,000 ounces of gold per month.
The terms of the offer made to Teryl cannot be publicly disclosed at present.
What do we know about Teryl? I'm a little surprised no terms were announced....I didn't think a public company could announce something like this without the terms of the deal???
Personally I like the way Kinross continues to buy into junior gold companies however they really need to focus on what they have especially FDN and the surrounding concessions. After all its not everyday a major gold company makes no profit with gold well north of $1,000!!
If This Is Recovery...
November 13, 2009
In this issue:
If This is Recovery, Where Are the Taxes?
Last Business Standing
Stimulus, What Stimulus?
The Reality of Unemployment
Let the Good Times Roll
The Quick Double-Dip Scenario
Phoenix, New York, and Thoughts on the Internet
No one goes into Wal-Mart and asks to pay extra sales tax. Thus sales taxes are reasonable barometers for retail sales. This week we look at how taxes are doing in a period of economic recovery. Then we turn our eyes to a very interesting (and sobering) analysis of possible future unemployment rates. This is an anecdote to the happy-face analysis of employment numbers you get from establishment economists. There will be a lot of charts and tables, so this letter may print a little longer, but I think you will find it very interesting.
If This is Recovery, Where Are the Taxes?
I keep reading about surveys that show that retail sales are up. But as noted above, no one pays extra sales taxes, or decides they need to pay more income taxes. The surest way to measure retail sales is sales taxes. Want to know how incomes are doing? Look at income tax receipts. Let's look at sales taxes first.
First off, I can find no single source of recent sales tax information. It is all one-off, but it is consistent. Sales taxes in my home state of Texas are down 12.8% year-over-year, and we're in the fifth straight month of decreases of 11% or more. Projections are for sales taxes to continue to decline into 2010.
There is a very revealing study by the Pew Center on state taxes, called "Beyond California" (http://www.pewcenteronthestates.org/). Everyone knows how bad California is. The Pew Center looks at how the rest of the states are doing, and focuses on 10 states that also have severe problems. Sales tax receipts are down 14% in Arizona, and state income taxes are down 32%.
On average, revenues are down almost 12%. Oregon has seen their revenues collapse a stunning 19%. New York is down 17%, with a deficit of 32%. Illinois has a projected deficit of 47% of its budget, second only to California with 49%. You can see how your state fares at http://downloads.pewcenteronthestates.org/Beyond_California_Appendix.pdf.
The Liscio Report notes that all states had negative year-over-year sales tax collections in October, and the weighted average decrease was 10.2%, down from a negative 7.2% in September. (www.theliscioreport.com)
Sales at Wal-Mart stores slipped by 0.4% in the third quarter. Actual government figures show that retail sales were down 1.5% in September from the previous month and 5.8% year-over-year. So how do we keep seeing headlines about retail sales being up, as unemployment keeps rising?
Remember that such reports are usually based on surveys, and generally cover mid-sized and up retailers, leaving out smaller businesses. Further, if you are a retail chain that has closed 10% of its stores, the remaining stores should in theory benefit from getting your loyal customers into them.
Last Business Standing
Yesterday I was with an associate, and I hesitated in asking them how their business was doing, because I knew things had been tough at the beginning of the year. But I did ask, and they said sales were up over the last months and business was looking better. Surprised, I asked them what made the difference. "Ah," they said, "less competition. Our competitors have gone out of business."
Best Buy and other electronic retailers had to benefit from Circuit City disappearing. That is Schumpeter's creative destruction at work. Not very good for total employment, but it does help the profitability of the survivors.
So, if things are so bad, how did we have 3.5% growth in the third quarter? First off, things are not as bad as they were in the past year. We are in fact getting close to an economic bottom, at least for now. Second, the 3.5% number is a preliminary estimate. A study by Goldman Sachs suggests that the number will be revised down by at least 0.5% and maybe as much as 1%.
Why? The estimate does not really take into account how poorly small businesses are performing. If you look at small-business indexes and compare them to historical GDP numbers, you get the smaller number mentioned above. And since at least 2% of the GDP was from the stimulus package (Cash for Clunkers, houses, tax cuts), the economy on its own was flat. That begs the question, what happens when the stimulus runs out?
And the answer is that we won't know for some time, as the stimulus is just getting ramped up. "According to CBO estimates, only 21% of [the stimulus] spending will occur in 2009; another 38% will come in 2010, and 22% in 2011. After that, its effect will dissipate quickly." (The Liscio Report)
But David Rosenberg notes that what the federal government is giving, the states are taking away. The Pew Study shows that at least nine other states are in appalling shape, so it is no wonder that David writes:
Stimulus, What Stimulus?
"Fully nine states are in fiscal distress and only two have balanced budgets. States like Michigan are planning 20% budget cuts for the coming year. Indiana is planning a 10% spending cut in light of a 7.4% YoY revenue decline. How can the economy really be out of recession if government revenues are still deflating?
"The states are filling around 40% of their fiscal gaps with the federal stimulus (so much for spending on "shovel ready" infrastructure projects). Even after the fiscal help from Washington, the state governments will still face a projected deficit of $142 billion for 2011 (versus $113 billion in 2010). All in, the restraint in the state and local government sector is estimated to drain a full percentage point from U.S. GDP growth in 2010 and more than fully offset the stimulative efforts from Washington. The U.S. economy is more likely to post growth of little more than 2% next year, rather than the 5% currently being discounted by the equity market."
The Reality of Unemployment
All this is, of course, going to put continued pressure on employment. As I noted last week, the number of unemployed actually soared by 558,000, to 15.7 million, as measured by the household survey, not the 190,000 you read about in the mainstream media. Unemployment is sadly continuing to rise by significant amounts.
In August, I did an interview with CNBC from Leen's Fishing Lodge in Maine. The unemployment numbers had just come out. I did a back-of-the-napkin estimate that we would need about 15 million new jobs over the next five years just to get back to where we were when the recession started.
That works out to a need for about 125,000 new jobs each month to handle new workers coming into the market (which comes to a total of 7.5 million over five years), plus the 8 million and rising jobs we've lost. That is a daunting number. It amounts to 250,000 new jobs a month every month for five years. And we are still losing more than that number a month, let alone adding the needed 250,000.
Look at the chart below. It shows the establishment survey employment figures for the last ten years. Only once, in 1999, did we actually add over 250,000 jobs a month for a whole year. And that was during the internet boom.

Sadly, the private sector has shed over 300,000 jobs since 1999. Think about that. We have had a decade where there have been no new jobs added by the private sector. Real incomes are roughly where they were, and the stock market is down. Talk about a lost decade.
I love it when someone does the really heavy lifting for me, and my friend Mike Shedlock of Sitka Pacific Capital Management has done a wonderful job of taking that speculation of mine and putting it into a spreadsheet that helps us get a real handle on what unemployment is likely to look like for the next ten years. I am going to make use of his basic analysis and then modify some of his assumptions in the spreadsheet he provided me, in order to think about different scenarios.
All three scenarios are based on assumptions, so let's see what Mish started with. There is a wealth of data available from the Bureau of Labor Statistics and the Census Bureau. According to the Census Bureau Population Estimates we are going to add about 2.5 million working-age (16 years old and up) citizens a year, from now until 2020. The numbers varies slightly year to year. Mish used an estimate of the average, summing up the buckets from 16 to 100+ for the years in question and rounding the result.
You can go to the BLS site and look at Table A-1, which shows the civilian noninstitutional population (those over 16 not in prisons), the participation rate (those who are working and/or want to work), the unemployment rate, the number employed, those not in the labor force, and those who want a job. Those are starting numbers for the charts below.
For those interested, you can read Mish's very full (and quite detailed) analysis at his blog site http://globaleconomicanalysis.blogspot.com/2009/11/mish-unemployment-projections-through.html). But let's look at his assumptions:
- Job losses are likely to continue for a minimum of another year.
- When job gains start, they will be very slow at first, then pick up.
- An extremely generous monthly job gain stat over the course of the year would be 150,000 jobs.
- A falling participation rate (boomers retiring) will continue to mask reported unemployment.
- Starting in 2013 the labor pool will start decreasing because of Boomer demographics.
- The noninstitutional population will rise by 2.5 million workers a year.
The spreadsheet below needs a little explanation. Let's start with the assumptions. Mike starts with current working-age population and adds 2.5 million people a year. He assumes that Boomers will retire at 65 (something which all the surveys say is not going to happen). And his last estimate is what the unemployment numbers will be. Everything else is based on those assumptions, which leads to the first column, or the expected unemployment number.
By the way, we know that everyone will want to make different assumptions. I am going to create three scenarios, but you can go to Mike's blog and at the bottom of the post is a link to the actual spreadsheet. Have fun. Let's look at scenario 1.

This assumes there is no double-dip recession, and jobs roughly rise along the same lines as the last recovery. Actually, Mish is far more optimistic, as in the very first chart you will notice that job losses were negative in the first year after the end of the recession and flat the second year. Mish has jobs rising by 120,000 next year and 600,000 the second year (2011), and then a fairly robust recovery. Below is the graph of the unemployment numbers under such a scenario.

Notice that unemployment stays at or above 11% for three years. Pessimistic? Mainstream and usually very optimistic Mark Zandi of www.economy.com predicted this week that unemployment would rise to 11% by the middle of next year, right in line with this scenario. Also note that total jobs rise by 14 million over ten years. Hardly doom and gloom. Again, Boomers all retire on time and there is no double-dip recession.
Let the Good Times Roll
What would it take to get back to 5% unemployment? I played with the spreadsheet and came up with the following numbers, which get us below 5% by 2020. I assume no recessions for the next ten years, and 2 million new jobs a year after 2011, which I start off with almost 1.5 million jobs. Of course, we have never done that, but let's be optimistic.

And the graph below shows the unemployment numbers for the Good Times Scenario.

Want to get to 5% within five years? Add 3 million jobs a year starting now. With no housing recovery, a smaller auto industry, and financial firms getting leaner.
The Quick Double-Dip Scenario
When I called the last two recessions about a year before they happened, it was not all that hard. We had inverted yield curves, falling leading indicators, and a lot of other data that pretty much pointed to a recession. Believing that we had a housing bubble and a looming credit crisis also helped my conviction in calling the last recession.
I think we are in for a double-dip recession in 2011, yet I readily admit there will be little if any statistical evidence in advance this time. This is more of an instinct call. I have serious doubts that we can have what amounts to the largest tax increase of all time in what will be a very weak (albeit growing) economy, without putting us back into recession. And Speaker Pelosi thinks it is a smart thing to add another 5.4% surtax on what will already be a rising capital gains and dividend tax.
Taxing small businesses, and that is what the tax increase amounts to, is a very bad idea in a weak economy. Small businesses are where the job growth comes from. Taking money from productive businesses and giving it to government is a fundamentally flawed concept.
Now, if they decide to postpone the tax increase, or phase it in slowly, then maybe we avoid the double dip. But right now it doesn't look like that will be the case. So, let's quickly see what a double-dip scenario might look like. Let's be optimistic and assume we only lose another 1.2 million jobs in the next recession, since we have already lost so many in this one (8 million and counting). And then the economy comes roaring back in 2012 with 1.5 million jobs and continues to grow rather smartly for the rest of the decade. No further recession. We absorb the tax increases and move on with our economic lives.
Unemployment under such a scenario would rise to just under 13% and stay above 10% for 8 years. Take a look at the chart and graph.


Think 13% is too dire? This week David Rosenberg said unemployment would rise to between 12-13%. The former Merrill Lynch economist was one of the few mainstream economists who called the recession and the credit crisis. The so-called "Blue Chip" economists told us at the beginning of 2008 that unemployment would peak out at 6%. While Rosie is not optimistic of late, he has a rather solid record of being right.
We are at 10.2% unemployment today. The economy lost jobs for 21 months after the end of the last recession. That would easily take us into 2011. Another million lost jobs will take us well over 11% and close to 12% (remember, you have to add in the increasing population), even without my double-dip scenario.
The letter is getting long and it's getting late, so let me close with a few thoughts.
First, 12% unemployment is horrendous by American standards. But Spain is now at 20%, and much of Europe has been in the 10% range for years.
Second, Americans are not used to the concept of 12% unemployment or 10% rates for extended periods. That is going to cause a serious backlash across the political spectrum. Couple that with the discomfort over $1.5-trillion deficits and there could be some serious political changes in the coming years. I think the message will be more anti-incumbent than one party or the other.
Third, the only way out of this morass is to create an environment where small business can thrive. As I've noted for the last several weeks in this letter, government spending does not increase GDP over time. It is a temporary nonproductive stimulus. It takes private investment to create jobs and increase productivity. Over the next few months, I will write more about how to do that.
Phoenix, New York, and Thoughts on the Internet
Next week I take a quick one-day trip to Phoenix, then back to do a satellite-remote speech to a South African hedge fund conference. I will be in New York the first weekend of December (the 4th) for Festivus, a great fundraiser for kids sponsored by Todd Harrison and the team at Minyanville (http://www.rpfoundation.org). Interestingly, they hold it every year at a "Texas" barbecue joint. Look me up if you are there.
The 7 kids, spouses, and grandkids are starting to gather. We will all have brunch Sunday and then a shower for Tiffani. She has another 6 weeks before she is due, and she is really uncomfortable. Walking is literally a pain.
Permit me to reminisce. A little over 9 years ago I started this letter on the internet with about 2,000 email addresses. It was a new version of what had been a print letter, as that was the business I knew. The internet was still a new thing to me, but it seemed like a good idea at the time. Little did I know.
I am still amazed at the growth and the direction my business and life have taken. My letters are sent out by various publishers and affiliates to over 1.5 million readers and posted on dozens of web sites, and the numbers have been growing rapidly of late. I am grateful. But I wonder what would happen if I started it today. Ten years ago there was little in the way of free economic letters. Not a lot of competition.
Today, there is so much free information that it's staggering. There have to be thousands of blogs and hundreds of free letters, some with very large circulations. It seems a new star is born every few months. While much of it does not add to the level of conversation, some of it is quite excellent. I think I am lucky to have started when I did.
And I am grateful for the kind attention you give me. As I turn 60, I note that this has been a rather overwhelming last ten years. A lot of changes for me, and almost all of them very good. But there are more to come. The last two flights I was on I was connected to the internet at 35,000 feet. I sense a lot more changes coming. I am thinking a lot about how to keep up and not get left behind, how to make sure that you, gentle reader, continue to get my best. That is what, at the end of the day, drives me.
Have a great week. I know I shall. Dad loves it when his kids (from 15 to 32) and spouses and grandkids are all under one roof.
Your amazed at it all analyst,
John Mauldin
John@FrontLineThoughts.com