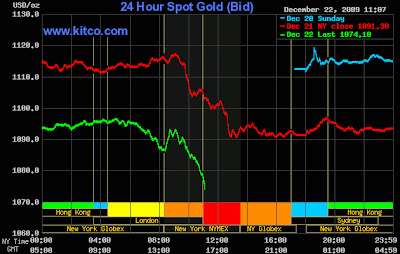
It would be interesting to see the NYCOMEX comment on this manipulation data...
Plain as day - VHF
-
Excellent Opportunity To Buy Gold
Eric deCarbonnel
December 23, 2009
With gold prices having dropped from $1220 to $1080 in the last few weeks, it is time to examine what is driving gold prices down. However, before looking at recent charts of gold price movement, I want to point to an entry I made on July 5 on the manipulation of gold.
For anyone out there who still doubts that gold prices are being heavily suppressed by the US and the UK, I have included a dozen gold charts I have saved up during the last few months (nearly all of May and June). By looking at these charts of the 24-hour spot price of gold, the meaning of “four out of five trading days over a one-year period the COMEX closed lower than the London AM fix” becomes perfectly clear.
Time zone color code
To help make the manipulation of gold even more crystal clear, I have added a time zone color code.

Green: Period when the Hong Kong gold market is open, but before the open of the London gold market. This is the only time of the day where gold prices are NEVER attacked (ie: no sharp selloffs).
First Blue: Period after the London gold market opens, but before the Hong Kong market closes. Generally, nothing to dramatic happens here, however there are occasional sharp selloffs.
Yellow: Period when only London physical gold market and NY GLOBEX are open. While the London is a physical market (which makes more difficult to manipulate), London is deeply involved in the suppression of gold. It is central banks dump their gold onto the market (via leasing or direct sales).
First Orange: Period after COMEX gold trading begins, but before the London market closes. The orange and red is where gold rallies are killed and brutal selloffs occur. Consistently, gold will go into the orange/red in rally mode and come out the other side in a selloff. It is also where gold prices go off a cliff as a result of relentless selling in the NY paper gold markets. (Any rallies in this first orange time zone are due to the London physical gold market being open)
Red: Period when only the COMEX gold market (NYMEX) is open. There is one day (May 21) that gold actually managed to rally in the in the red. That day also saw an abnormal surge in open interest on the COMEX, which means someone was shorting the hell out of gold at the same time as the price was rising. (See *****Who sold 65 tons of COMEX gold in the last two days?*****)
Second Orange: Period after the COMEX closes until the Sydney gold market opens.
Second Blue: Period after Sydney gold market opens but before Hong Kong market opens. Again, most of the time nothing drastic happens here, except for the occasional sharp selloffs.
3 Things to look for in the graphs below:
1) In the charts below, gold prices repeatedly spike downwards due to intense selloffs. Notice that these downward spikes never, ever happen in the green time zone.
2) All the big sharp upwards spikes in gold prices only happen when the physical gold markets are open. The Sydney, Hong Kong, and London are the physical gold markets.
3) Notice how the orange/red time zones seem to suck the life out of gold prices, while the green/blue time zones seem to put gold into rally mode.
Now let us see if the pattern of gold price manipulation holds true during the last month.
Asian buying drives up gold prices
Nov 22: Gold breaks over $1150, jumping up to $1165 up during Asian trading.

Dec 01: Gold breaks over $1180, surging up to $1210 during Asian trading.

Gold attacked during US trading
Dec 04: Gold is viciously attacked during US trading, breaking under $1200 and falling $50.

Dec 08: Gold breaks under $1140 during US trading

Dec 09: Gold breaks under $1120 during US trading

Dec 17: Gold breaks under $1110 during US trading

Dec 21: Gold breaks under $1100 during US trading
Dec 22: Gold breaks under $1080 during US trading

Excellent opportunity to buy gold
Gold prices are being unnaturally suppressed during US trading. This means gold prices are artificially low, making it an excellent opportunity to buy gold.


