
LegacySpecial's Profile
LegacySpecial's Posts
Gold’s Sweet Spot - Strongest Months Are August, September, November And January
Published on 1 August 2014
By Mark O’Byrne
Today’s AM fix was USD 1,284.50, EUR 959.16 and GBP 762.99 per ounce.
Yesterday’s AM fix was USD 1,295.00, EUR 966.92 and GBP 767.36 per ounce.
Gold fell $14.60 or 1.13% yesterday to $1,282.10/oz and silver slipped $0.25 or 1.21% to $20.37/oz.

Seasonal Gold - Gold’s Strongest Months Are August, September, November
Palladium was the only one of the major precious metals to rise in July, climbing 3.2% for its sixth month of gains. Platinum was down 1.8%, silver down 3% and gold down 3.4%.
Silver for immediate delivery was little-changed in London at $20.40 an ounce. Platinum fell marginally and was at $1,463/oz. Palladium was marginally lower at $871/oz and remains near the 13 year nominal high of $889.75/oz.

Gold In U.S. Dollars - 10 Years
Gold is marginally higher in London this morning and overnight in Singapore, goldremained in a tight range between $1,280/oz and $1,285/oz. With Asian trade limited to a narrow band of just $5.00, volumes traded in late trade on Globex were low at just 9,000 lots (GCZ4).
Futures trading volume in London declined and was 31% below the average of the last 100 days. Traders are waiting for the non farm payrolls data later today.
The jobs number is expected to be good after the positive surprise that was the GDP number. The GDP number has rightly been questioned as the growth in inventories contributed 1.66% and likely greatly exaggerated the strength of the U.S. economy in the 2nd quarter.
Markets are jittery and global stock markets are seeing losses with all U.S. indices down yesterday and Asian and European indices down today. Economic and trade war with Russia, conflict in the Middle East and the risk of contagion in Portugal and from Argentina’s default are weighing.
Institutional money is being allocated to gold again as seen in the ETF numbers.Gold ETFs saw their largest monthly inflow in July since December 2012, according to Reuters data, having added 7.4 tonnes to their holdings. Gold ETP holdings hit a four-year low in mid June at 1,491 tonnes, but have since seen some inflows.
Premiums for gold bars in India remain near recent lows due to weak domestic demand. The premium on Wednesday fell to $5-$6 per troy ounce compared with $10 per troy ounce during the last week.
Gold prices have been in lockdown in a range bound month. The spread between July's high and low was just $57.54. This is the narrowest in seven years - the June 2007 range was $54.70. This was right before the global financial crisis.
In 2007, gold began to move up aggressively in September (see chart above). On September 1, it was trading at $672/oz. By early March 2008, it was over $1,000/oz - for a gain of nearly 50% of just 7 months.
Were gold to replicate the gains seen in that period in the coming months, gold would trade over $1,900 and close to new record nominal highs by the 2nd quarter of 2015. The real record high, adjusted for inflation, is of course $2,400/oz. We continue to believe it will be reached before 2020.
Global Conflict and Currency Wars a Threat to Economies and People
The New Cold War risks devolving into actual conflict between Russia and Western powers. We are in the early stages of trade, economic and currency wars. Competitive currency devaluations were a precursor to World War II and actual conflict is a real risk now. Complacency is rife among financial advisers, brokers and bankers and the public is being lulled into a false sense of security ... again.
It remains prudent to hope for the best but be prepared for less benign scenarios.
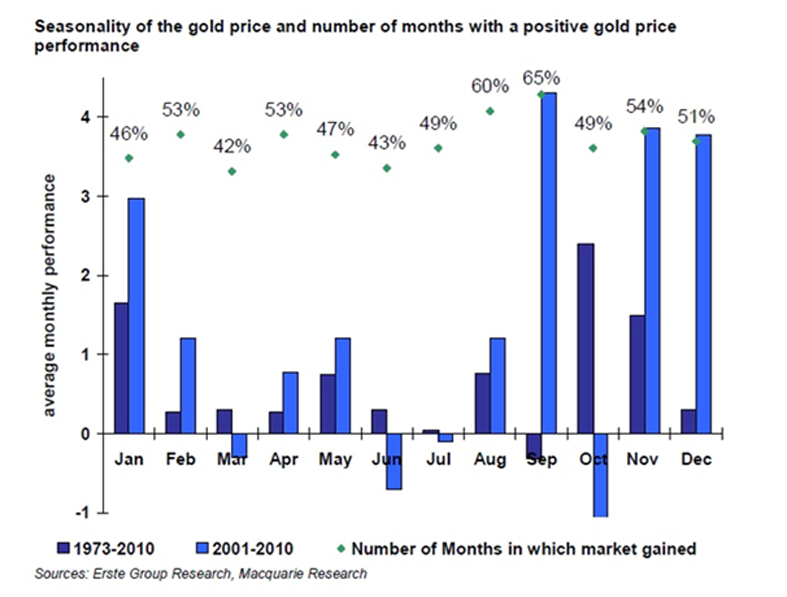
Gold’s Strongest Months Are August, September, November And January
The summer months frequently see seasonal weakness as has been the case in recent years and since gold became a traded market in 1971. Gold and silver often see periods of weakness in the summer doldrum months of May, June and July.

Gold Seasonal - Monthly Performance and Average (10 Years)
Gold’s traditional period of strength is from early August into the autumn and early winter. Thus, early August is generally a good time to buy after the seasonal dip.
Today, we commence August trading and August along with September and November, are some of the best months to own gold. This is seen in the charts showing gold’s monthly performance over different time frames - 1975 to 2011, 2000 to 2011 and the Bloomberg Gold Seasonality table above from 2003 to 2013.

Late summer, autumn and early New Year are the seasonally strong periods for the gold market due to robust physical demand internationally. This is the case especially in Asia for weddings and festivals and into year end and for Chinese New Year when voracious China stocks up on gold.
Gold’s weakest months since 1975 have been June and July (see tables). Buying gold in early August has been a good trade for most of the last 34 years and especially in the last nine years, averaging a gain of nearly 13% in just six months after the summer low.
Thackray's 2011 Investor's Guide notes that the optimal period to own gold bullion is from July 12 to October 9. In the previous 25 years, gold bullion has outperformed the S&P 500 Index by 4.7%.
Conclusion
Gold’s ‘summer doldrums’ period is coming to a close. Traditionally seasonal factors often result in weakness in the precious metal markets, particularly in June and July creating an attractive buying opportunity.
The data is compelling but it is important to realise that the seasonal data is just another indicator. Gold’s recent weakness could continue in the coming months. Therefore, short term speculation should be avoided in favour of long term investment diversification.
Investors should, as ever, avoid attempting to time the market and consider cost averaging their purchases. This way they protect themselves from market falls and also from buying again at much higher prices.
Absolutely nothing has changed regarding the fundamentals driving the gold market. We are confident that gold, and particularly silver, are still in long term secular bull markets likely for a 15 to 20 year duration.
Owning physical coins and or bars in your possession and owning physical gold and silver in allocated and most importantly in segregated accounts will continue to protect and grow wealth in the coming years.
The Silver Institute Releases Report on the Outlook for New Electrical & Electronic Uses of Silver
Silver Industrial Demand Expected to Outpace Global GDP Growth Through 2016
(Washington, DC – July 31, 2014) The Silver Institute today released a report titled “The Outlook for New Electrical and Electronic Uses of Silver.” The report identifies three key potential growth areas for silver demand: flexible electronics; light emitting diodes (LEDs); and interposers. These three growth areas combined have the potential to add another 20 million ounces of silver to total demand by 2018.
The report was produced by Metals Focus, the London-based independent precious metals research consultancy, on behalf of the Silver Institute.
Highlights of the report include:
- According to Metals Focus, silver industrial demand, which accounts for over 50 percent of global demand, is expected to grow 5 percent per year from 2014-2016, outpacing forecasted global GDP growth.
- Within the flexible electronics sector, the report forecasts notable gains in silver use for flexible displays. Flexible displays, which incorporate silver, can be found in tablets, cell phones and e-readers.
- The report indicates a healthy rise in LED demand, driven by falling costs and increasingly stringent lighting energy legislation that will accelerate LED adoption, thus leading to strong growth for silver demand.
- Interposers that include silver could hold considerable promise for future silver demand. Interposers enable far greater functionality in the next generation of semiconductor chips. Given the greater technical demands made of interposers, glass, with the addition of silver, is being considered as an alternative material. Metals Focus maintains that should glass (and therefore silver) prevail as the interposer technology of choice, silver demand is on course to benefit.
- The report also examines the outlook for established end-uses, such as silver’s use in ethylene oxide (EO) production, which is a key building block chemical in the production of detergents, solvents and plastics. Silver demand in the EO sector has enjoyed near uninterrupted growth over the past 30-40 years, primarily due to the growing demand for a range of consumer and industrial products. The EO category could witness even greater silver demand, especially in the United States, with the advent of shale gas, potentially yielding new EO plants.
- Metals Focus also reports that silver’s use in photovoltaics for solar power installations may well surpass its previous demand peak, registered in 2011, as early as 2016-17.
“With the introduction of these advanced uses of silver in the electrical and electronics category, which last year provided over 40 percent of total silver industrial demand, along with growth in established uses, we should see silver industrial demand develop even further, especially as economies grow globally,” stated Michael DiRienzo, Executive Director of the Silver Institute.
ROMARCO ANNOUNCES FINAL EIS PUBLICATION
ROMARCO MINERALS INC. (TSX: R) (the “Company”) is pleased to announce that the US Army Corps of Engineers (“Corps”) has informed the Company it will release its Final Environmental Impact Statement (the “Final EIS”) for the Haile Gold Mine project on its www.hailegoldmineeis.com website either today Thursday, July 24, 2014 or tomorrow Friday, July 25, 2014. The Final EIS is a major milestone in the Haile Gold Mine permitting process.
After being posted on the Corps’ website, the Notice of Availability for the Final EIS will be published in the Federal Register which is usually within seven days, followed by a minimum 30-day period before the Corps may take final action on the pending Federal permit application. The Corps’ permit (pursuant to Section 404 of the Clean Water Act) is the only Federal environmental permit Romarco requires for the Haile project. The Company will continue to cooperate with the Corps as it develops its Record of Decision on the permit.
Diane Garrett, President & CEO commented: “The publication of the Final EIS is the culmination of approximately three years of comprehensive environmental and technical studies and analyses. We are pleased that the process has reached this point and grateful for the overwhelming support of the local community throughout the EIS process.”
In 2013, the Company received four State permits – the National Pollutant Discharge Elimination System permit, Air Quality permit, Dam Safety permit, and Stormwater Construction permit. The State permits or authorizations remaining for the Haile project include, among others, the State Mine Operating permit, and 401 Water Quality Certification. A list of other required permits is included in the Company’s National Instrument 43-101 compliant technical report filed on SEDAR on March 19, 2012.
Globe says Romarco Minerals hiked to "outperform"
2014-07-31 06:30 ET - In the News
The Globe and Mail reports in its Thursday, July 31, edition that RBC Dominion Securities analyst Sam Crittenden upgraded Romarco Minerals (90 cents) to "outperform" from "sector perform" and raised his price target to $1.25 from $1. The Globe's Darcy Keith writes in the Eye On Equities column that the company provided more clarity on the permitting timeline for its Haile project, which RBC views as one of the best early-stage gold projects. Mr. Crittenden says: "We view Romarco as a takeover candidate once permits are received based on potential for low-cost production, the scalability of the project, and regional exploration potential. ... Using similar metrics to B2Gold's recently announced acquisition of Papillon Resources would imply 20-per-cent upside from the current share price (Fekola is higher grade, while Haile has better infrastructure and lower geopolitical risk, and both projects have above average grades and meaningful exploration upside." Ramarco said this week that the United States Army Corps expects to issue its permitting decision on the project in November of this year. That would allow for construction to start in early 2015, with potential for first gold production in late 2016.
Coeur Announces Results of La Preciosa Feasibility Study; Mine Construction Deferred
July 30, 2014Share on google_plusone_share
Chicago, Illinois – July 30, 2014 – Coeur Mining, Inc. (“Coeur” or the “Company”) (NYSE: CDE) announced results from a feasibility study on the La Preciosa silver-gold project located in Durango state, Mexico and announced the Company’s decision to defer construction activities at this time.
Mitchell J. Krebs, Coeur’s President and Chief Executive Officer, said, “Our team was able to improve the economics of La Preciosa by an estimated $180 million since completing a Preliminary Economic Assessment (“PEA”) in June of last year. However, a 29% decline in silver prices since announcing the acquisition of Orko Silver in February 2013 and higher taxes on precious metals mines in Mexico have led the Company to conclude that now is not the optimal time to proceed with construction of La Preciosa.
“We consider La Preciosa to be one of the best silver projects in North America and I am confident it will become a cornerstone mine for Coeur at some point in the future. The proposed mine would be Coeur’s largest source of silver production and would lower the Company’s overall cost structure. Our decision to not proceed at this time was based on our disciplined capital deployment philosophy and our commitment to retaining a flexible, liquid balance sheet. The feasibility study demonstrates a very attractive project at higher silver and gold prices. Deferring construction enables us to maintain the project’s leverage to better macro conditions and provides time to pursue limited drilling and metallurgical work to further improve the expected project economics.”
Highlights of the Feasibility Study:
- 10% internal rate of return (“IRR”) based on silver and gold prices of $22 and $1,350 per ounce, respectively
- Declared initial proven and probable mineral reserves of 126 million silver ounces and 209 thousand gold ounces increases Companywide silver and gold reserves by 50% and 10%, respectively
- Once in production, La Preciosa would be the world’s sixth largest primary silver mine1 with average annual silver production of over ten million ounces
- 12% decrease in projected initial capital expenditures compared to the PEA to $307 million
- 10% decline in expected costs applicable to sales per silver equivalent ounce2 versus the PEA to $14.37
- 5% increase in overall silver grade compared to the PEA
- Feasibility work completed on time and under budget
- Based on 2013 production published by The Silver Institute.
- Non-GAAP measure. Silver equivalence assumes 60:1 ratio.
Select 2014 Feasibility Study Metrics versus July 2013 PEA
2013 PEA
2014 Feasibility
Silver/gold price per ounce
$25/$1,500
$22/$1,350
Initial estimated capital expenditures
$348 million
$307 million
Estimated sustaining capital expenditures
$84 million
$127 million
Strip ratio
10.6:1
15.6:1
Estimated initial mine life
17.0 years
10.5 years
Average daily processing rate
11,000 tons/day
11,000 tons/day
Average silver/gold grade
2.7/0.004 oz/ton
3.4/0.006 oz/ton
Silver/gold recovery rate
86% / 82%
84% / 61%
Average annual silver/gold production
9.1m oz Ag / 15k oz Au
10.3m oz Ag / 12k oz Au
Total silver/gold production
135m oz Ag / 226k oz Ag
107m oz Ag / 128k oz Au
Costs applicable to sales per AgEq ounce1
$15.89
$14.37
After-tax IRR
17%
10%
After-tax NPV (5% discount)
$314 million
$94 million
After-tax NPV (10% discount)
$130 million
$(1) million
Note: the scope of the PEA includes inferred mineral resources at La Preciosa whereas the feasibility study does not.
- Non-GAAP measure. Silver equivalence assumes 60:1 ratio.
Economic Sensitivity Analysis
Silver
NPV@5%
NPV@10%
IRR%
Payback
Price
($ millions)
(years)
$30
$498
$306
28%
2.4
$28
$398
$230
24%
2.7
$25
$255
$122
18%
3.5
$22
$94
$(1)
10%
6.9
$20
$(9)
$(80)
5%
9.3
Coeur plans to continue limited activity at La Preciosa, including a $1.5 million exploration program with an emphasis on potential high-grade resource conversion, metallurgical optimization testwork, and testwork on a potential heap leach scenario for lower-grade material. This additional optimization work is expected to be completed by in the first half of 2015. The expected annual holding cost of deferring mine construction is less than $2 million.
On July 2, 2014, Coeur acquired a pre-existing 3% NSR on La Preciosa for $12.0 million.
Detailed results of the feasibility study will be included in a Canadian National Instrument 43-101 compliant Technical Report that will be filed on SEDAR within 45 days.
La Preciosa Mineral Reserves and Resources
Short Tons
Grade (oz/t)
Ounces (000s)
(000s)
Silver
Gold
Silver
Gold
Proven Reserves
20,244
3.31
0.006
66,920
118
Probable Reserves
20,899
2.85
0.004
59,523
90
Total Proven and Probable Reserves
41,143
3.07
0.005
126,443
209
Measured Resources
7,539
2.45
0.005
18,485
41
Indicated Resources
11,618
2.58
0.005
29,920
54
Total Measured and Indicated Resources
19,157
2.53
0.005
48,405
95
Total Inferred Resources
2,082
2.26
0.004
4,705
8
Mineral reserves and resources effective July 29, 2014 using metal prices of $22 per silver ounce and $1,350 per gold ounce for reserves and $25 per silver ounce and $1,400 per gold ounce for resources. For details on the estimation of mineral resources and reserves for La Preciosa, please refer to the new Technical Report for the La Preciosa feasibility study to be filed within 45 days on www.sedar.com. Mineral resources are in addition to mineral reserves and do not have demonstrated economic viability. Inferred mineral resources are considered too speculative geologically to have the economic considerations applied to them that would enable them to be considered for estimation of mineral reserves, and there is no certainty that the inferred mineral resources will be realized.
Not too bad at all. Legman
Eldorado Gold earns $39.51-million (U.S.) in Q2 2014
2014-07-31 17:58 ET - News Release
Mr. Robert Gilmore
ELDORADO GOLD CORPORATION: 2014 SECOND QUARTER FINANCIAL AND OPERATING RESULTS
Eldorado Gold Corp. has released its financial and operational results for the second quarter ended June 30, 2014. All figures are in U.S. dollars unless otherwise stated. Net profit attributable to shareholders of the company for the quarter was $37.6-million, or five cents per share.
"The company has finished the second quarter ahead of our expectations and the operations are now on track to deliver production at the high end of the initial full-year range our teams had established. Total gold production for the period was 200,551 ounces, and cash operating costs continue to remain in the bottom quartile of the gold industry at $489 per ounce," said Paul Wright, chief executive officer of Eldorado Gold. "We are especially pleased to report that the Kisladag EIA [environmental impact statement] was approved during the quarter by the Turkish authorities, and we plan on completing the expansion to 20 million tonnes per year by mid-2016. Reflecting the strong results year to date and our outlook for the balance of 2014, we are confidently revising our guidance for the year to production of 790,000 ounces of gold with average cash costs for commercial production of $495 per ounce and all-in sustaining cash costs of $850 per ounce."
Second quarter financial and operational highlights
Throughout this press release, the company uses cash operating cost per ounce, total cash costs per ounce, all-in sustaining cost per ounce, gross profit from gold mining operations, adjusted net earnings and cash flow from operating activities before changes in non-cash working capital as additional measures of company performance. These are non-international financial reporting standards (IFRS) measures. Please see the management discussion and analysis for an explanation and discussion of these non-IFRS measures.
SUMMARIZED FINANCIAL RESULTS
(in millions of U.S. dollars, except where noted)Three months ended Six months ended
June 30, June 30, June 30, June 30,
2014 2013 2014 2013Revenues $ 265.5 $ 266.9 $ 545.4 $ 605.0
Gold revenues $ 247.6 $ 243.6 $ 495.2 $ 550.8
Gold sold (ounces) 190,621 176,260 381,249 365,606
Average realized gold price
(US$ per ounce) $ 1,299 $ 1,382 $ 1,299 $ 1,506
Cash operating costs
(US$ per ounce sold) $ 489 $ 478 $ 504 $ 492
Total cash cost
(US$ per ounce sold) $ 549 $ 536 $ 563 $ 552
All-in sustaining cash cost
(US$ per ounce sold) $ 829 n/a $ 809 n/a
Gross profit from gold
mining operations $ 100.8 $ 117.2 $ 196.2 $ 281.0
Adjusted net earnings
(millions) $ 35.9 $ 48.2 $ 73.2 $ 131.5
Net profit (loss) attributable
to shareholders of the company $ 37.6 $ 43.3 $ 68.9 $ (2.2)
Earnings (loss) per share
attributable to shareholders
of the company
-- basic (US$/share) $ 0.05 $ 0.06 $ 0.10 $ 0.00
Earnings (loss) per share
attributable to shareholders
of the company
-- diluted (US$/share) $ 0.05 $ 0.06 $ 0.10 $ 0.00
Dividends paid (Cdn$/share) $ 0.00 $ 0.00 $ 0.01 $ 0.07
Cash flow from operating
activities before changes in
non-cash working capital $ 92.2 $ 84.9 $ 186.9 $ 224.8
Financial results
Net income for the quarter was $37.6-million (or five cents per share), compared with $43.3-million (or six cents per share) in the second quarter of 2013. Gold revenues of $247.6-million were 2 per cent higher year over year as higher gold sales volumes were partially offset by lower gold prices. Gross profit from gold mining operations was 14 per cent lower than that of the second quarter of 2013, reflecting higher production costs and depreciation expense as a result of higher sales volumes. Total cash cost per ounce increased 2 per cent year over year.
Exploration expenses fell $6.4-million year over year, reflecting changes in the company's exploration program in response to lower gold prices. The company reported a foreign exchange gain of $1.6-million for the quarter, as compared with a loss of $5.9-million for the second quarter of 2013, mainly as a result of changes in foreign exchange rates on the company's Canadian-dollar investments. Interest and financing costs fell $3.1-million year over year, reflecting an increase in capitalization of interest on the company's Greek development projects.
The effective tax rate for the quarter was 39 per cent as compared with a rate of 36 per cent in the second quarter of 2013. The effective tax rate for the second quarter of 2013 was lower due to a tax recovery related to recognition of investment tax credits in Turkey, partly offset by the impact of movements in the Turkish lira on deferred tax balances. The effective tax rate for the second quarter of 2014 was higher due to higher withholding tax accruals on dividends from the company's Turkish and Chinese subsidiaries.
Operations update
Kisladag
Gold production at Kisladag during the quarter was level year over year, while sales of approximately 4,600 ounces of gold were delayed into the third quarter due to the timing of dore shipments to the refinery. Leaching of run-of-mine ore placed on the pad during the first quarter of 2014 contributed to gold production during the second quarter, making up for lower tonnes and grade year over year. Cash costs in the quarter were higher than the same period of 2013 due to lower head grade and an increase in operational waste mining (4.9 million tonnes in 2014 versus 700,000 tonnes in 2013). Capital expenditures during the quarter included equipment for expansion and capitalized waste stripping.
Efemcukuru
Gold production at Efemcukuru during the quarter was lower year over year, and cash operating costs per ounce were higher, mainly due to a lower planned average treated head grade. Capital spending in the quarter included costs related to capitalized underground development and mobile equipment, surface infrastructure, and process improvements.
Tanjianshan
Gold production at Tanjianshan during the quarter was lower year over year as a result of lower average treated head grade and recovery rate. Capital spending included exploration activities and waste stripping.
Jinfeng
Gold production at Jinfeng during the quarter was higher year over year and cash operating costs per ounce were lower mainly due to higher tonnes milled, average treated head grade and recovery rate, mainly due to ore production from the open pit. The open pit had resumed full mining operations midway through the second quarter of 2013 after completion of a cutback. Capital spending during the quarter included underground mine development and tailings dam construction.
White Mountain
Gold production at White Mountain for the quarter was higher year over year mainly as a result of increased process throughput, higher head grades and improved recovery rates. Cash operating costs per ounce decreased significantly due to higher gold production and reduced operation costs. Capital spending this quarter included underground development, exploration, camp improvements and completion of the new mobile maintenance workshop.
Vila Nova
Vila Nova recorded a loss of $3-million for the quarter compared with gross profit of $1.8-million in the second quarter of 2013. A $1-million negative price adjustment related to shipments in prior quarters impacted profitability. The average realized iron ore price for the quarter, not including the price adjustment, fell from $106 per tonne to $56 per tonne year over year. The company is reviewing options to improve profitability at Vila Nova in light of the recent decline in iron ore prices.
Stratoni
Combined metal concentrate production at Stratoni for the quarter was level year over year, with lower lead concentrate production offset by higher zinc concentrate production as a result of changes in metal head grades. The average realized combined concentrate price increased year over year as zinc prices improved while lead prices weakened. Taken in conjunction with the increase in zinc concentrate production the change in metal prices contributed to Stratoni's gross profit performance year over year.
Development project update
Kisladag mine expansion
During the quarter, the company received a positive EIA decision from the Ministry of Environment and Urbanization of Turkey on the Kisladag mine expansion project. The EIA approval will allow for the expansion of the Kisladag open-pit mine production from its current 12.5 million tonnes per year to a maximum of 35 million tonnes per year. The company has decided to proceed with an expansion to an annual production rate of 20 million tonnes per year of crushed ore to the leach pad at an additional capital cost of approximately $90-million. The company is forecasting completion in mid-2016, producing an average of 325,000 ounces per year in the first five years after expansion.
Skouries
Major structural concrete placements for the SAG and ball mills commenced in the quarter. The SAG mill foundation was completed, and concrete placement in the SAG mill plinths began. The majority of the ball mill concrete piles were completed and reinforcing fabrication and formwork for other major plant foundations was continuing. Mill mechanical equipment was being preassembled in a nearby warehouse and will be mobilized to site with on-site erection scheduled to begin in the third quarter. Construction of access roads to the tailings dam progressed during the quarter. A review of the tailings dam construction materials and methodology was completed and design modifications to enhance constructability were finalized. Site earthwork continued during the quarter, and included excavation and fill for the regrind mill, the flotation area and the tailings thickening area. The site batch plant construction commenced and is scheduled to be completed in the third quarter. The open-pit surface area was cleared, and topsoil removal commenced. Progress continued on the underground decline during the quarter. Capital spending totalled $29.7-million during the quarter.
Olympias
Approximately 168,000 tonnes of tailings were reprocessed during the quarter at a grade of 2.84 grams per tonne. A total of 6,179 payable ounces of gold in concentrate were produced. Cash proceeds from the sale of concentrate generated $11.8-million during the quarter on approximately 9,300 ounces of gold in concentrate. Capital spending totalled $35.6-million during the quarter, including approximately $11-million related to tailings reprocessing, production royalties, and transportation and selling costs, $1.9-million related to capitalized interest, and the remainder on mine development, as well as phase II engineering.
Perama Hill
Preliminary engineering continued on the project during the quarter with completion expected in the third quarter this year. Metallurgical test work to optimize the process is planned to be completed during the third quarter this year, with detailed engineering expected to begin shortly thereafter. The company continues to work with Greek government authorities to facilitate approval of the environmental impact assessment. Capital spending totalled $3.1-million during the quarter.
Certej
During the quarter, studies were conducted focusing on optimization of critical elements of the project identified in the prefeasibility study, including pressure oxidation, oxygen supply, open-pit development and use of Romanian resources to build the mine. Metallurgical test work continued during the quarter in order to provide further data for optimization of the pressure oxidation circuit. The company plans to commence work on the feasibility study in the third quarter this year. Capital spending totalled $2.3-million during the quarter.
Tocantinzinho
During the quarter, work continued on optimization of the Tocantinzinho feasibility study. Additionally, preparations were begun to upgrade the access road to the site, including obtaining the necessary permits and authorizations from the municipality. Capital spending totalled $500,000 during the quarter.
Eastern Dragon
Eastern Dragon remained on care and maintenance pending resolution of permitting issues. Site management worked with the local authorities to maintain local permits and permissions in good standing. Work continued on the preparation of the revised environmental impact assessment for submission to the Ministry of Environmental Protection. This will be followed by submission of the project permit approval to the National Development and Reform Commission.
Exploration update
Greece
In the Halkidiki district, underground exploration drilling continued at the Mavres Petres mine, targeting the western extension of the orebody. Several drill holes cut massive sulphide zones outside of the existing resource, and activities are now focused on extending underground development to allow further step-out drilling. Drilling commenced late in the quarter at the Piavitsa deposit with a 6,000-metre program planned to test the continuity of mineralized zones identified in previous widely spaced drill holes. At the Olympias deposit, drilling completed in the east ramp development project encountered several significant zones of high-grade gold and silver mineralization that lie outside of the current resource model.
In the Perama district, exploration activities focused on extending geological mapping coverage in the Perama South area, conducting reconnaissance field visits to nearby prospects and evaluating historical data for the newly acquired Sappes project.
Romania
Exploration activities during the quarter near Certej focused on defining drill targets at the Magura, Bocsa and P. Avram prospect areas. Reconnaissance mapping, soil sampling and drill hole targeting commenced during the quarter at the nearby Muncel and Brad exploration licences.
Turkey
Exploration activities in Turkey focused on reconnaissance of regional target areas in western Turkey and definition of new drilling targets at the Efemcukuru mine site.
China
Underground drilling at White Mountain targeted downplunge extensions in the middle and north ore zones. Detailed geological mapping was conducted over the mine area, and surface exploration drilling programs will commence in the third quarter. At Tanjianshan, drilling programs were completed at the Xijingou deposit and Dushugou prospect, and drilling is continuing at the Qinlongtan North deposit.
Brazil
Exploration resumed at the Tapajos region projects, including soil sampling along the Tocantinzinho trend northwest of the Tocantinzinho deposit, and drill testing of geochemical anomalies at the adjacent Ruben Zilio project.
2014 outlook
Total gold production for 2014 is forecast to be 790,000 ounces of gold with average cash costs for commercial production of $495 per ounce and average all-in sustaining cash costs of $850 per ounce. Previous guidance was production of 730,000 to 800,000 ounces at average cash costs of $550 to $590 per ounce and average all-in sustaining cash costs of $915 to $985 per ounce. Capital spending is forecast to be $170-million in sustaining capital and $265-million in project development capital, compared with previous guidance of $170-million and $345-million, respectively. The forecast for project development capital is lower than original guidance mainly due to presently projected lower capital spending at Skouries.
The company is evaluating the merits of pursuing a potential overseas listing on the Hong Kong Stock Exchange in relation to its Chinese business. Eldorado is the largest foreign producer of gold in China with three operating gold mines (Jinfeng, Tanjianshan and White Mountain) and the Eastern Dragon project. The company's Chinese operations presently produce roughly 300,000 ounces of gold annually.
Conference call
Eldorado will host a conference call on Friday, Aug. 1, 2014, to discuss the 2014 second quarter financial and operating results at 8:30 a.m. PDT (11:30 a.m. EDT). You may participate in the conference call by dialling 416-340-2219 in Toronto or 1-866-225-0198 toll-free in North America and asking for the Eldorado conference call.
The call will be available on Eldorado's website. A replay of the call will be available until Aug. 8, 2014, by dialling 905-694-9451 in Toronto or 1-800-408-3053 toll-free in North America and entering the passcode 5888733.
2014 SECOND QUARTER GOLD PRODUCTION HIGHLIGHTS
(in U.S. dollars)First Second Second First First
quarter quarter quarter six months six months
2014 2014 2013 2014 2013
Gold production
Ounces sold 190,628 190,621 176,260 381,249 365,606
Ounces produced (1) 196,523 200,551 183,971 397,074 347,739
Cash operating
cost ($/oz)(2)(4) 519 489 478 504 492
Total cash cost
($/oz)(3)(4) 577 549 536 563 552
Realized price
($/oz sold) 1,299 1,299 1,382 1,299 1,506
Kisladag mine,
Turkey
Ounces sold 66,852 72,815 76,680 139,667 146,930
Ounces produced 67,075 76,980 76,735 144,055 146,956
Tonnes to pad 3,856,882 3,127,844 3,301,333 6,984,726 6,216,841
Grade (g/t) 0.73 1.11 1.26 0.90 1.28
Cash operating
cost ($/oz)(4) 456 443 327 449 331
Total cash cost
($/oz)(3)(4) 473 466 348 470 353
Efemcukuru mine,
Turkey
Ounces sold 27,647 25,435 25,187 53,082 75,478
Ounces produced 26,969 25,034 26,289 52,003 46,145
Tonnes milled 106,501 110,706 109,349 217,207 196,228
Grade (g/t) 8.56 7.99 9.28 8.27 8.91
Cash operating
cost ($/oz)(4) 526 552 519 538 561
Total cash cost
($/oz)(3)(4) 547 576 537 561 592
Tanjianshan mine,
China
Ounces sold 28,379 25,790 27,938 54,169 54,145
Ounces produced 28,379 25,790 27,938 54,169 54,145
Tonnes milled 263,609 278,227 273,065 541,836 520,126
Grade (g/t) 3.44 3.30 3.50 3.37 3.61
Cash operating
cost ($/oz)(4) 422 391 398 407 419
Total cash cost
($/oz)(3)(4) 592 570 577 581 605
Jinfeng mine, China
Ounces sold 41,277 45,581 28,993 86,858 50,676
Ounces produced 41,295 45,568 28,889 86,863 50,631
Tonnes milled 364,987 371,971 336,707 736,958 688,608
Grade (g/t) 4.00 4.17 3.33 4.08 2.87
Cash operating
cost ($/oz)(4) 626 540 757 581 789
Total cash cost
($/oz)(3),(4) 709 622 845 664 881
White Mountain
mine, China
Ounces sold 26,473 21,000 17,462 47,473 38,377
Ounces produced 26,473 21,000 17,462 47,473 38,377
Tonnes milled 200,682 213,741 203,033 414,423 401,967
Grade (g/t) 4.13 3.56 3.25 3.84 3.52
Cash operating
cost ($/oz)(4) 607 583 742 596 683
Total cash cost
($/oz)(3)(4) 646 623 781 636 726
Olympias, Greece
Ounces sold - - - - -
Ounces
Produced (1) 6,332 6,179 6,658 12,511 11,485
Tonnes milled 144,522 168,013 116,972 312,535 206,084
Grade (g/t) 3.08 2.84 3.80 2.95 3.86
Cash operating
cost ($/oz)(4) - - - - -
Total cash cost
($/oz)(3)(4) - - - - -(1) Ounces produced include production from tailings retreatment
in Olympias.
(2) Cost figures calculated in accordance with the Gold Institute Standard.
(3) Cash operating costs, plus royalties and the cost
of off-site administration.
(4) Cash operating costs and total cash costs are non-international
financial reporting standards measures. Please see the company's
management discussion and analysis for an explanation
and discussion of these.
CONDENSED CONSOLIDATED INCOME STATEMENTS
(in thousands of U.S. dollars)Three months ended Six months ended
June 30, June 30, June 30, June 30,
2014 2013 2014 2013
Revenue
Metal sales $265,497 $266,929 $545,367 $604,997
Cost of sales
Production costs 122,524 116,133 257,309 246,501
Depreciation and amortization 44,095 35,234 89,667 72,348
166,619 151,367 346,976 318,849
Gross profit 98,878 115,562 198,391 286,148
Exploration expenses 3,890 10,240 7,785 17,864
General and
administrative expenses 19,099 18,239 34,943 34,725
Defined benefit
pension plan expense 413 619 816 1,248
Share-based payments 5,281 3,291 12,275 12,168
Foreign exchange loss (gain) (1,553) 5,920 (2,914) 5,818
Operating profit 71,748 77,253 145,486 214,325
Loss (gain) on disposal of assets 1,819 (51) 1,825 (15)
Loss (gain) on marketable
securities and other investments 550 - 1,322 (21)
Loss on investments in associates - 214 102 1,123
Other (income) (3,631) (3,138) (2,847) (5,114)
Asset retirement obligation
accretion 581 386 1,163 725
Interest and financing costs 7,916 11,061 16,321 21,562
Profit before income tax 64,513 68,781 127,600 196,065
Income tax expense 24,999 24,550 57,443 195,802
Profit for the period 39,514 44,231 70,157 263
Attributable to
Shareholders of the company 37,632 43,274 68,900 (2,189)
Non-controlling interests 1,882 957 1,257 2,452
Profit for the period 39,514 44,231 70,157 263
Earnings per share attributable
to shareholders of the company
Basic earnings per share 0.05 0.06 0.10 0.00
Diluted earnings per share 0.05 0.06 0.10 0.00