Gold Bullion Development Corp.
Gold Bullion Development Updated Chart
We called it a “sell on news”. John, BMR’s technical analyst, calls it a “soak-up” – investors eagerly but patiently gobbled up Gold Bullion shares Friday as stock moved from weak hands into strong hands. GBB remains very healthy technically, underpinned by strong support as John explains below. As a new week begins, all of Gold Bullion’s major moving averages are in bullish alignment. The fundamentals are also strong with GBB demonstrating that LONG Bars Zone drilling is successfully expanding the Eastern Extension as well as currently targeting the under-explored and highly prospective northern half of the Preliminary Block Model:
John: Friday was a day of investor reaction for GBB after the long awaited news release. To some investors the news was disappointing but to many others it confirmed their belief (and BMR’s) that Granada will become another major gold deposit in northwestern Quebec.
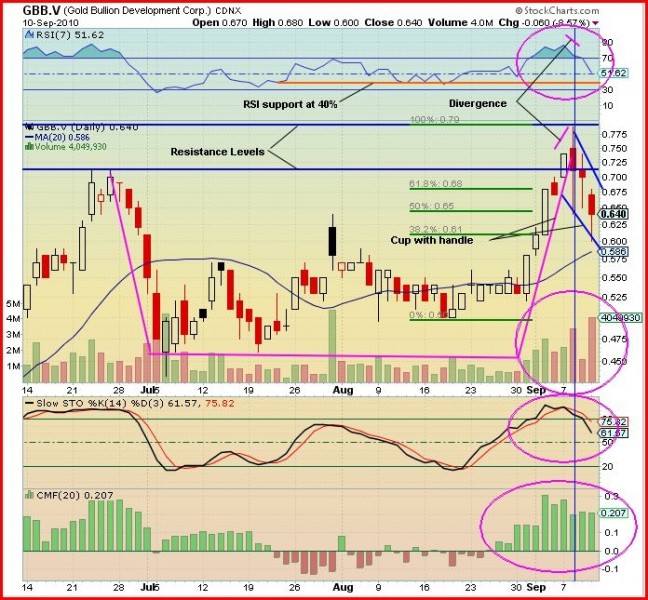
The stock started trading at 67 cents, rose to 68 cents and then drifted down to a low of 60 cents before closing at 64 cents on a total volume (CDNX and Alpha) of 5.7 million shares. No, this was not a “sell-off “. It was a “soak-up”. All day long investors eagerly but patiently waited to gobble up stock from any weak hands. At the end of the day on the CDNX there were 324 lots on the bid at 63 cents and just 41 on the offer at 65 cents. Remember, there are a hundred reasons to sell but only one to buy.
The last GBB chart we presented was for Sept. 3, a weekly chart that showed a cup without a handle. This week we show that same cup on a daily chart but this time it has grown a handle. Looking at the 3-month daily chart above, we see the cup drawn in mauve lines and the handle in down-sloping blue lines. On Monday, Tuesday and Wednesday GBB gradually climbed to a new 52-week high of 79 cents which made the right hand side of the cup higher than the left hand side. This is unusual and it indicated the strength of the bulls.
Wednesday also saw the start of the formation of the handle with Thursday’s and Friday’s red candles taking the handle down to a low of 60 cents. The handle is a type of consolidation that occurs when a stock gets overbought and must unwind. The right hand side of the cup started at 50 cents on Aug 19 and as stated climbed to 79 cents. The Fibonacci levels (green horizontal bars) show that during this past week the stock has declined as low as the 38.2% level. With the buying strength shown last week I do not expect it to trade lower than 60 cents for this pattern to remain intact. The two horizontal blue lines are resistance levels at 71 cents and 79 cents, previous highs. The main support is provided by the Fibonacci 38.2% level and the SMA(20) which is also pointing up.
Looking at the indicators:
The RSI has fallen below the overbought region to 52% and also shows that a divergence occurred with price as shown on the chart. This gave forewarning that the handle would form. The support level is at 40% (horizontal orange line). The higher than normal trading volume in the last few days shows a “changing of the guard” so to speak of some stock. This is healthy and should not cause concern with the stock at these levels.
The Slow Stochastics has fallen below the overbought area and is still dropping, so expect more consolidation at least for the early part of next week.
The Chaikin Money Flow (CMF) was green all of last week, even during the formation of the handle. This shows the strength of the buying pressure.
Outlook: The chart and the indicators show that we can expect more consolidation in the handle during next week until the overbought condition has been completely or largely unwound. Of course, in the midst of a major drill program, there’s always the possibilty of a pleasant surprise, so we can’t rule out the possibility of more volatility – in this case with an upward bias given the clues we received in Thursday’s news release. The stated support levels should hold. This is just another step in the process of Gold Bullion developing a major deposit at Granada.
