http://seekingalpha.com/article/265699-no-sign-of-the-top-in-silver?source=yahoo
No Sign of the Top in Silver
Silver is finally getting some attention in the 10th year of its bull market run - mostly top callers who are calling the recent move to nearly $50 an ounce a sign that it has already peaked. Interestingly, these same analysts were nowhere to be found when we made the logical argument that it would reach $50 an ounce this year.
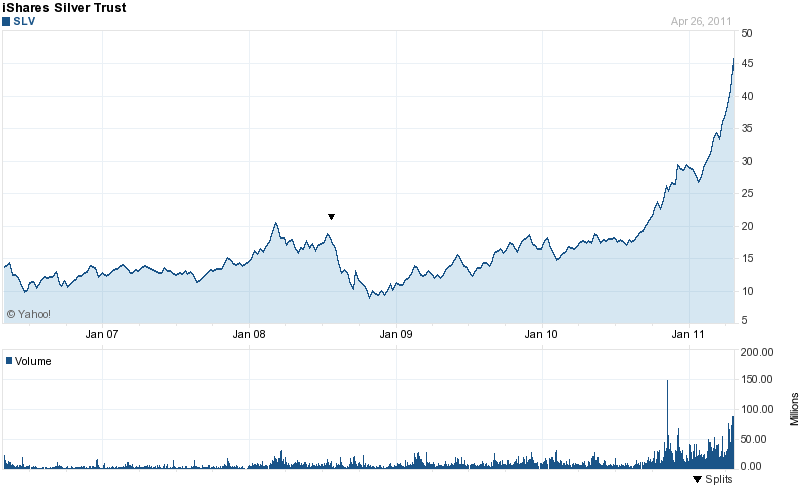
There have been many excuses in the past 10 years why investing in silver was a horrible idea, but the most recent is that it has already gone through its "parabolic" spike phase. Notice that this is always backed up with a well chosen linear chart (click to enlarge), that fits the author's linear thinking.
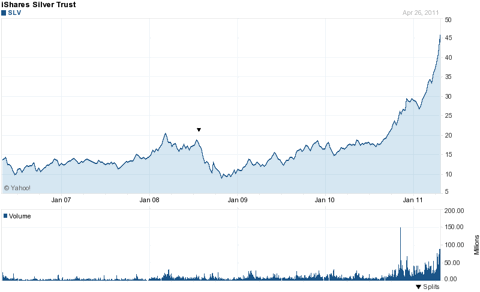
Of course that looks scary. However, any chart with a linear growth rate will appear geometric when compounded. A true parabolic move must be measured in logarithmic notation to be properly detected.
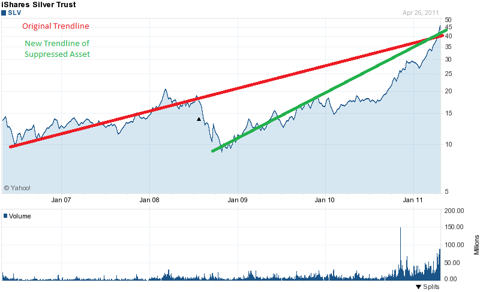
Using the above chart (click to enlarge), all we see is an asset catching up to its original trend line. Silver was already headed to $50 in 2007, but was suppressed in 2008. To compensate, the angle of the trend line increased simply because silver has had so much catching up to do. If there was a parabolic move, it was from 40 to 49, and is typical of short term tops as it became overbought on a short term basis.
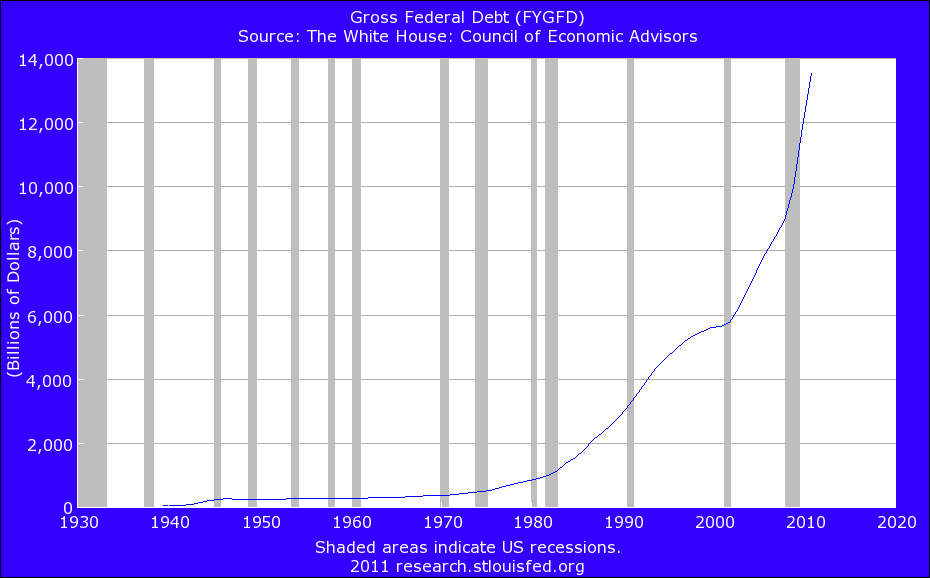
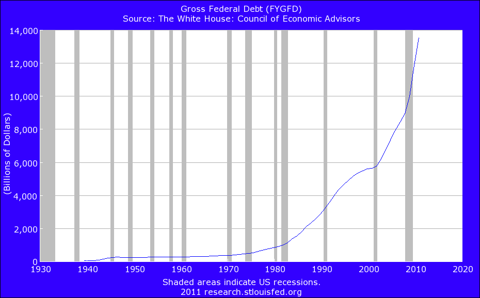
For anyone looking for a real parabolic move to worry about, consider the following chart (click to enlarge) of US Gross Federal Debt.
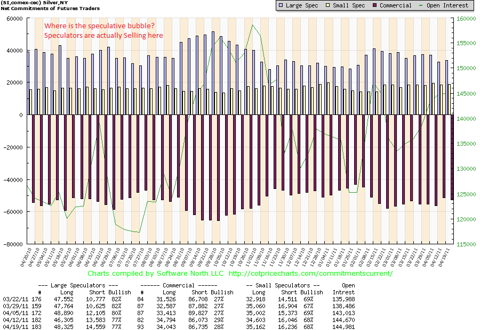
Another common argument against silver that we've heard lately is that it's been driven up by speculators in a manic bubble of epic proportions. This pattern would be driven by speculators bidding up prices in anticipation of even higher prices. However, the commitment of traders report shows no sign of speculation at all. In fact, speculators have been selling into the market rise! In addition open interest is lower than it was last August through October (click to enlarge).
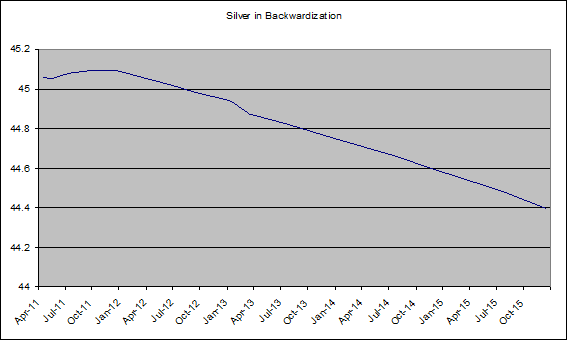
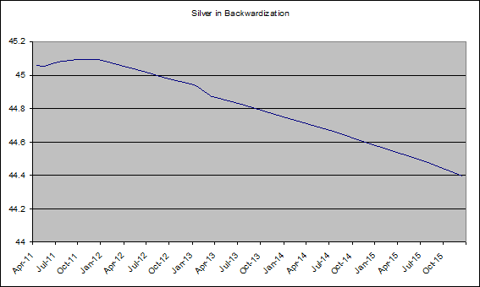
The most alarming factor to the silver market is that fact that even after the recent move upwards it has remained in backwardization. This implies that there is a real shortage of physical silver, which has not been mitigated even after the substantial rise in the price. Traders are paying nearly a dollar more an ounce to buy it now rather than later (click to enlarge).
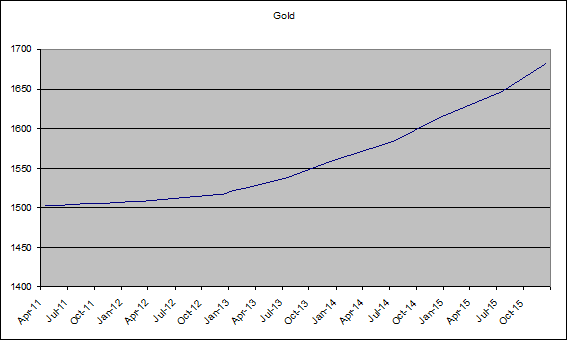
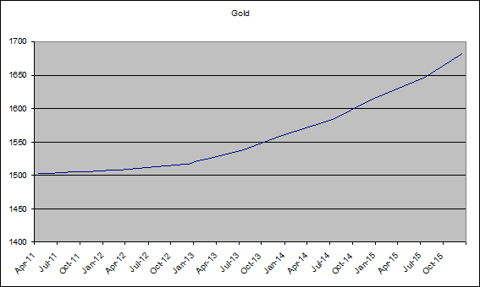
Normally, gold and silver are in contango with a correlated relationship to the yield curve. We don't anticipate it, but if gold ever enters backwardization it would likely indicate imminent hyperinflation (click to enlarge).
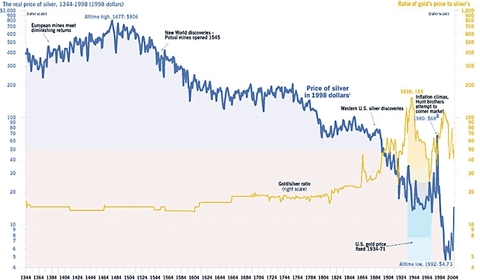
So what has really happened to silver? It has simply begun the generational process of reverting to the mean valuation in comparison to gold and other assets. The gold to silver ratio has fallen from 100 to 30 on its path to the natural mean of 16 where it has held steady for 5000 years of history. This means that over the long term, silver is still expected to nearly double the performance of gold (click to enlarge).
Silver may have seen a near term local top, however it has not seen the top in its ongoing bull market. It's in severe backwardization, speculators are selling, commercial shorts are unable to cover their positions, and major bullion dealers are struggling to meet increased investor demand. All the while, sentiment has already shifted to be bearish as almost everyone is expecting a huge correction in price. In fact, the structure of the silver market could not be more bullish.
Disclosure: I am long SLV, SLW, PAAS, SSRI, SVM, EXK, AG.