John: Today, Sidon International Resources (SD, TSX-V) opened at 11 cents and closed at 11.5 cents, its high for the day, on relatively light CDNX volume of 380,000 shares. Any investor watching the daily trading for the past few weeks may have come to the conclusion that this stock is drifting lower and weakening with no end in sight. The chart, however, tells a different story as I explain below:
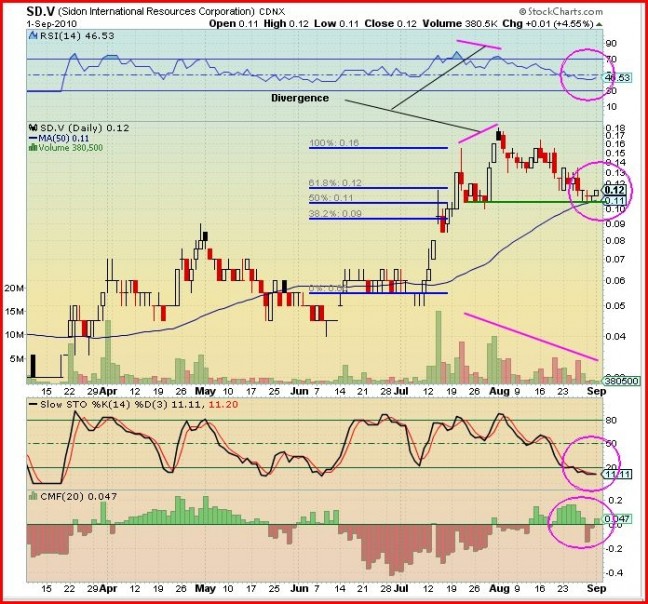
Looking at the 6 month daily chart we see that starting on July 9, Sidon rose from 6.5 cents to 16 cents in just 9 trading sessions (this is called the seed wave), then consolidated down to the 50% retracement level (Fibonacci levels shown as horizontal blue bars) of 11 cents which formed strong support (green horizontal line). Then in 3 trading sessions on July 28, 29 and 30, it climbed from 11 cents to 18 cents and from there drifted down to settle at its previous strong support of 11 cents which is where it traded today. Also, we see that the daily SMA(50) is providing strong support at 11 cents.
When a stock moves up very quickly from support as Sidon did, it gets too far from its supporting moving averages – thus its momentum is unsustainable. Today’s trading shows the stock has indeed stabilized and is now able to move up on good news, though keep in mind the company is in the process of completing a small financing ($1.2 million) at 10 cents so the next big move in SD (to new highs) is not likely to occur until that is finalized and out of the way.
We see that the 3 days prior to today were doji candles showing indecision between the buyers and the sellers, and then today we have a small white bullish candle, a possible bullish reversal which must be confirmed by another white candle tomorrow (Thursday).
Looking at the indicators:
The RSI is presently just below the 50% level and is turning up. We see that a divergence occurred when Sidon rose to 18 cents, indicating that a price decline was imminent. The average volume has been decreasing from July 9 to today. This has been a period when previous financing stock has been distributed and now that overhang of stock has gone.
The Slow Stochastics %K (black line) and the %D (red line) are together below 20%, thus with good news the stock has excellent potential to run higher.
The Chaikin Money Flow (CMF) indicator is now back in the green (bullish), showing that buying pressure is starting to build.
Outlook: Sidon is trading at strong support and all indicators show that this stock is ready to move up on good news. The technical outlook combined with the fundamentals of an interesting gold play in Tanzania create a very bullish scenario.

