Sidon International Resources (SD, TSX-V) has indeed been another BMR “home run”, tripling in value from July 9 to July 21 after the CDNX approved its letter of intent regarding the Morogoro East Gold Property in Tanzania. We’ve been writing about Sidon for a few months – we added the stock to the BMRPortfolio in March when it was sitting at just a nickel. Tonight, BMR’s technical analyst updates the near-term outlook for Sidon:
John: Sidon had been trading in a consolidation channel from mid-May until early July. Then on July 12, just before it received final approval from the CDNXon its letter of intent regarding the Morogoro East Gold Property in Tanzania, it broke out to trade at 7.5 cents. Since that time Sidon has traded as high as 15.5 cents and closed Friday at 12 cents.
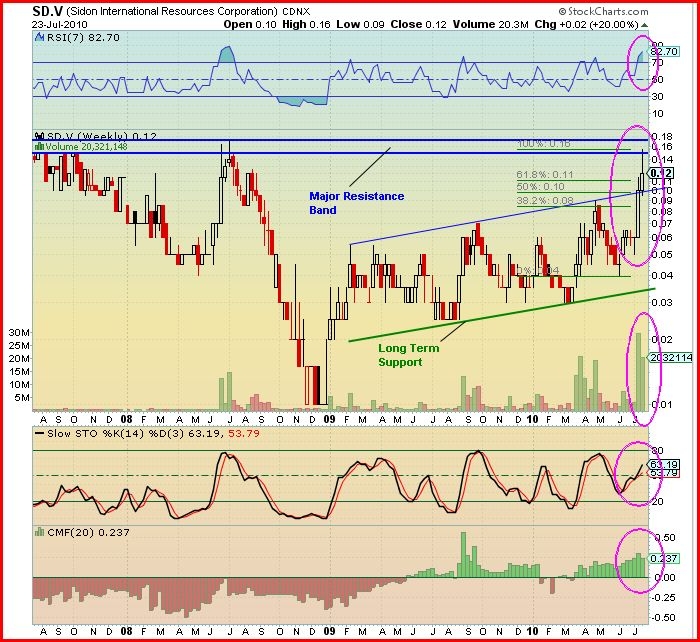
Looking at the 3-year weekly chart, we see a major resistance band (2 horizontal blue lines) based on previous highs during the June/July 2008 period. This band is between 15 cents and 17.5 cents. Sidon traded up to this resistance band last week but declined and began to consolidate.
Trading during the past 2 weeks, however, has broken through the long-term trend resistance (blue sloping line). This line now becomes long-term support (resistance becomes support after it has been broken).
Looking at the indicators:
During the past 2 weeks there has been a tremendous increase in volume with over 50 million shares traded. This demonstrates the need for a relatively large increase in volume to produce a substantial breakout.
The Fibonacci levels show support at 10 cents. This also coincides with the previous long-term resistance line.
The RSI is high at 82%, in the overbought region, but has enough room for the trading to test last week’s high of 15.5 cents.
The Slow Stochastics has the %K (black line) above the %D (red line) and pointing up, thus still providing room for a further test of the high.
The Chaikin Money Flow indicator is bullish in that it shows accumulation but the buying pressure of last week was less than the week before.
Outlook: We may see a test of the 15.5 cent high this coming week but with such a large and fast advance, I expect Sidon needs to consolidate with a support base of 10 cents before being able to stage a successful move through resistance between 15 and 17.5 cents.
